In the mid-1990s Alan Greenspan saw something the official statistics had not yet captured: computers and the Internet were letting the U.S. economy grow faster without a corresponding increase in inflation. Unemployment kept falling, and Greenspan kept not raising rates. The expansion that followed vindicated him, and gave every policymaker since a story to reach for.
Thirty years later that story is back, and this time it is the Treasury Secretary telling it. On September 27 Scott Bessent went on Fox News and urged the Fed to keep an "open mind" on rates; his argument was that productivity gains from AI and deregulation will keep inflation in check, he invoked Greenspan by name, and he added that Fed Chair Kevin Warsh was well aware of the parallel.
The Fed's answer had come eleven days earlier: it voted unanimously to raise its target range to 3.75%–4.00%. The bond market's answer, per my September 30 Thurible snapshot, is a 10-year Treasury at 5.29% and a 30-year at 5.63%.
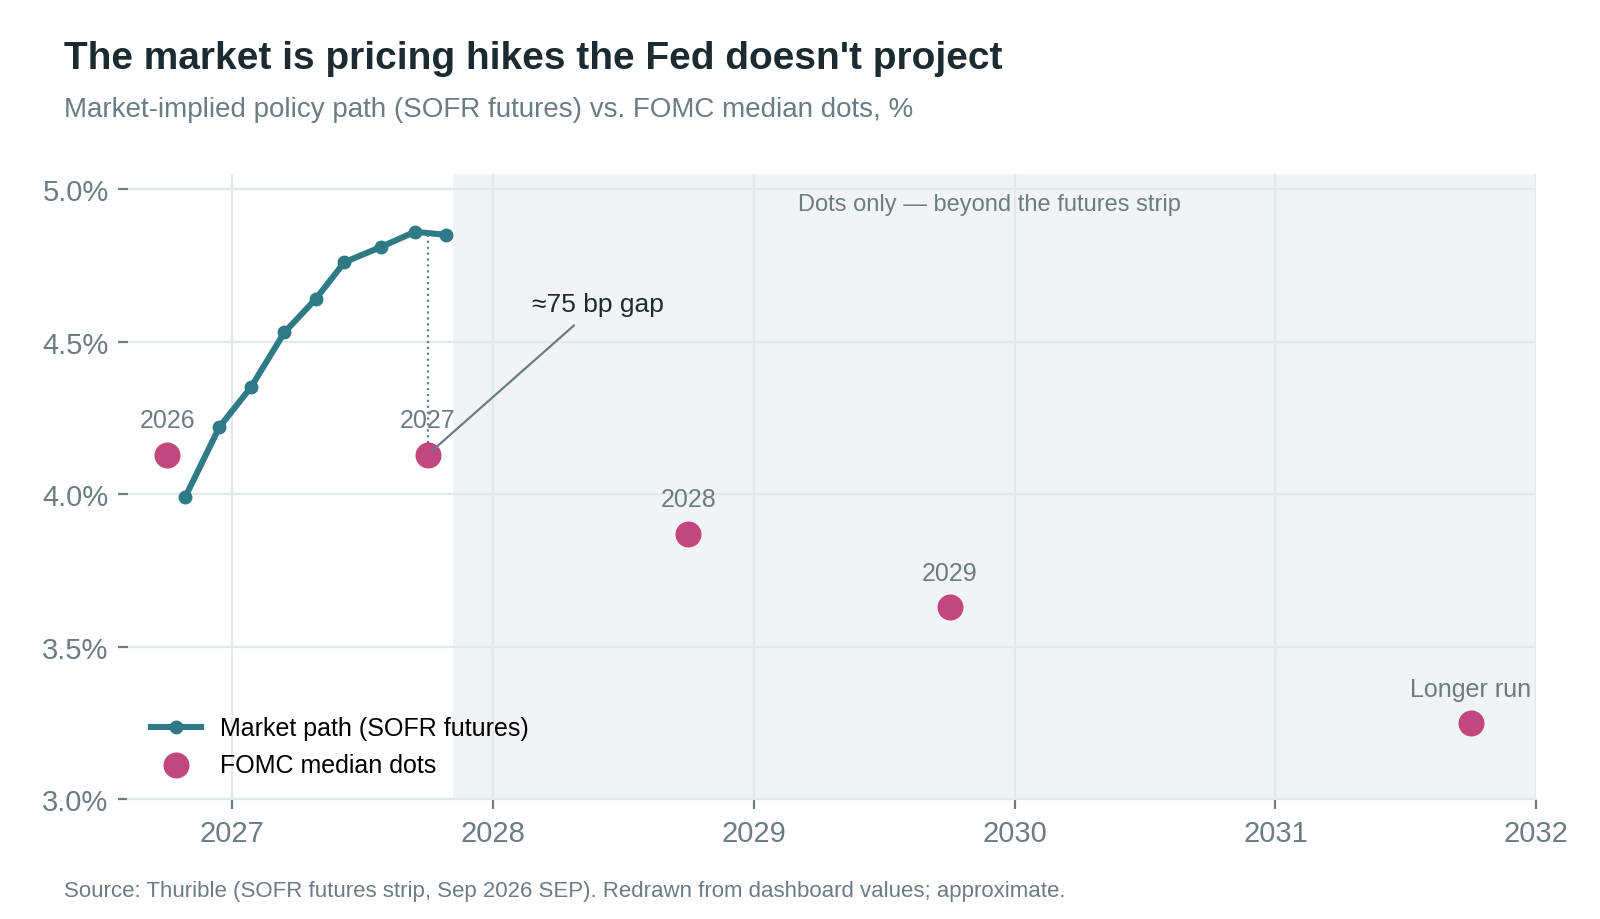
The chart shows the disagreement: the Fed's own projections drift toward a lower longer-run policy rate, while the path implied by SOFR futures rises into 2027; the gap is about 75 basis points at the horizon shown. The usual caveats apply. Futures prices include risk compensation, the dots are policymakers' conditional judgments, and yields in general move on inflation, the expected policy path, Treasury supply, and what investors demand for holding duration. I'm not going to pretend that 5.29% is a referendum on Bessent. What I will say is that this is a strange set of numbers for an economy that is supposedly on the cusp of a 1990s-style boom.
Here's the thing, though: I think Bessent may well be right about productivity. I just don't think that settles the question, because Greenspan wasn't only right; he was lucky.
Greenspan's Luck
The productivity boom of the 1990s arrived in about the best demographic setting imaginable. The baby boomers were in their prime working, tax-paying, and saving years; the U.S. old-age dependency ratio sat between 18.6 and 18.9 for the entire decade. Productivity gains became wages, wages became tax receipts, and those receipts were supporting a retired population that was, relative to the workforce, small.
This is the same question I asked about platforms earlier this week in AI Had Its iPhone Moment. It Won't Get the iPhone Economy.: a technology that makes something more efficient does not settle who keeps the gains. In the 1990s the answer was workers, and by extension the Treasury. In other words, the question for long-term rates is not whether AI raises productivity; it is whether that productivity ever shows up as taxable income, and whether that income can carry public obligations that keep growing as the population ages. That is the fiscal channel, and it is the one I want to follow.
The Layoff Channel
Bessent, to his credit, has been clear about how he expects the gains to arrive. This is what he told graduates in April:
Someone who knows how to use AI is going to take your job.
Notice what that sentence does and doesn't say. It describes a change in how work gets done; it says nothing about what happens to the income of the person whose job was taken. Challenger’s August report counts 529,914 announced job cuts through August, down 41% from the same period in 2025 (partly because there were fewer government cuts), and employers cited AI for 116,175 of them: about 22% of the total, and the leading reason year to date, although in August alone AI ranked fourth. These are announcements, not a measure of jobs AI actually displaced, and the report doesn't say who is being cut. If it is workers with established careers, mortgages, and dependents, the fiscal problem is considerably worse; that is a scenario to investigate, not something the data shows.
Still, this is the channel Bessent is describing, and it runs in the opposite direction from the 1990s: productivity that arrives by removing wages instead of raising them. For that to lower inflation, supply has to rise faster than demand and the lost wages can't be fully replaced by new work or other income, which means the disinflation Bessent wants comes paired with a smaller wage base to tax.
The Fed, for its part, isn't waiting to find out. Thurible tracks the remarks Fed officials make between meetings and scores them; positive is hawkish:
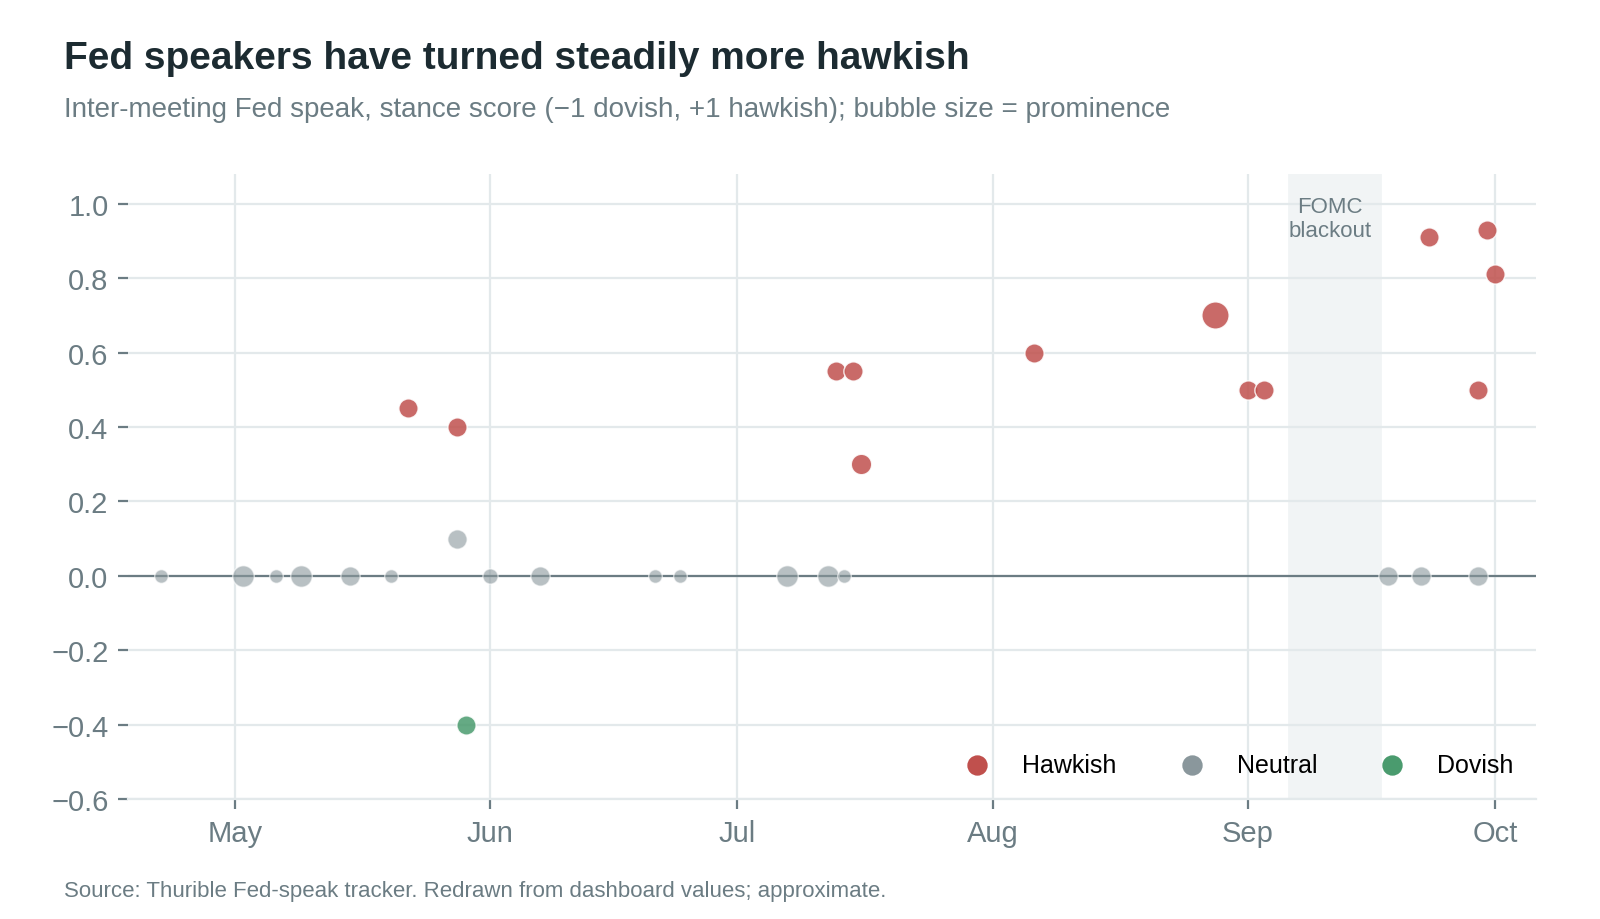
In May most remarks sat near neutral; from June on, the hawkish ones became more frequent and more forceful. There was a single dovish comment in the entire period, in late May, and since the September meeting every remark has been either neutral or hawkish. Even Warsh was careful in his July testimony to Congress:
We don't know the extent to which the economy will benefit
There is no contradiction in expecting AI to improve supply eventually and tightening against inflation today; those are judgments about different horizons. Expected productivity is not lower inflation in the current data, and the Fed is setting rates on the data.
What 5.29% Means
The obvious objection to reading anything into long rates is positioning: crowded trades unwind, and a selloff can run faster and further than fundamentals justify. That's true, and I think it is part of what happened in September. Here is Thurible's rate monitor on September 29; the shaded areas are the past 20 years' percentile bands, and the line is the current curve:
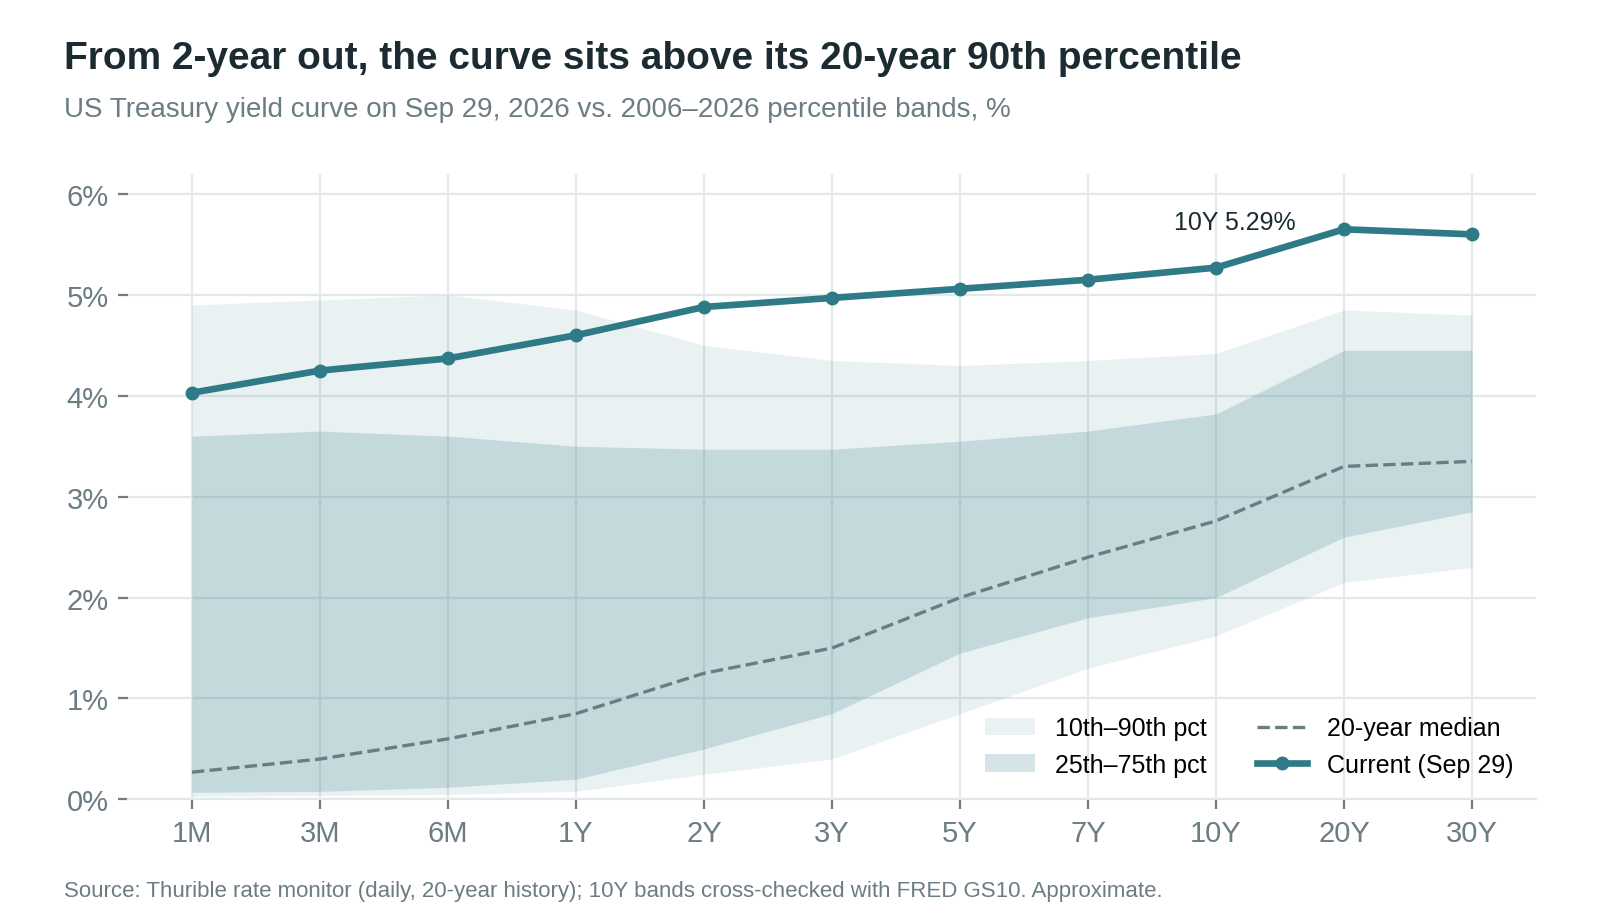
From the 2-year out, the entire curve sits above its 20-year 90th percentile. The ETF proxies on the same dashboard show what happened in the final week:
| Proxy | Curve point | Implied 5-day yield move |
|---|---|---|
| SHY (1–3Y Treasury) | 2Y | −5.3 bp |
| IEF (7–10Y Treasury) | 10Y | +13.4 bp |
| TLT (20+Y Treasury) | Long end | +21.5 bp |
The front end fell while the long end rose, which is to say the curve steepened because long bonds sold off. That is what you would expect from a term premium or supply story; it is also what you would expect from someone being forced out of a position, and ETF-implied moves can't tell the two apart. Funding data helps a little. This is SOFR minus interest on reserve balances:
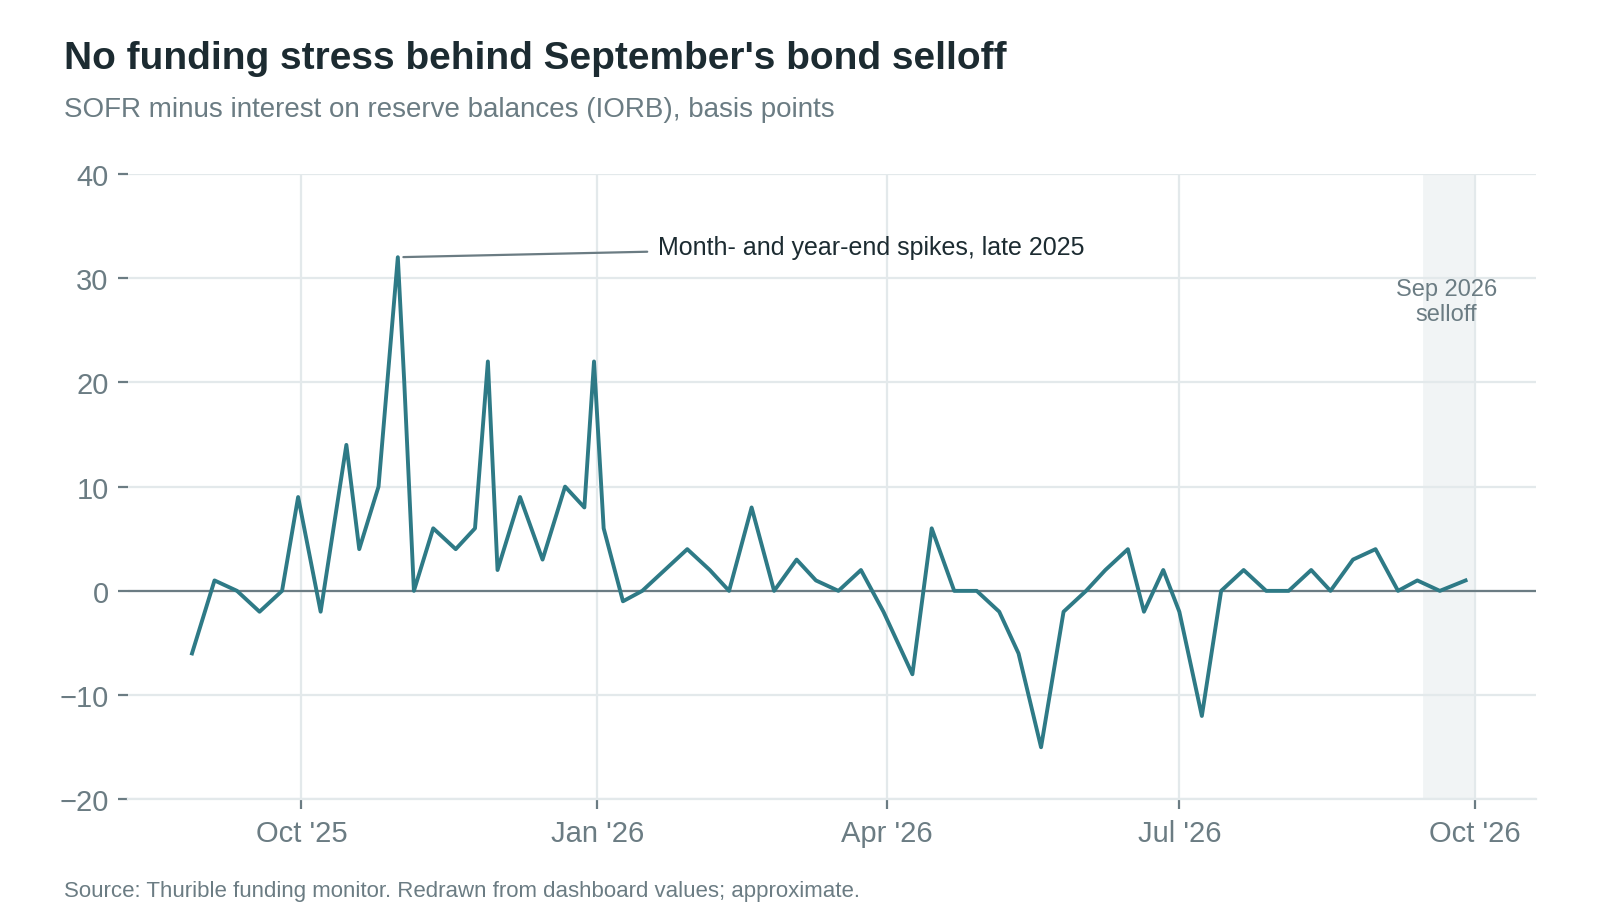
The spread stayed near zero through the September selloff, which argues against a broad funding squeeze like the earlier spikes on the chart (it doesn't rule out dealer constraints or stress in one particular strategy).
My read is that positioning amplified a repricing that also has a longer-run component, and the reason I think there is a longer-run component is that 5.29% is only extreme if your baseline is the years after the financial crisis:
| Lookback window | Median 10Y yield | Percentile of 5.29% |
|---|---|---|
| 2006–2026 | 2.76% | 100th |
| 1985–present | 4.44% | 63rd |
| 1962–present | 5.38% | 50th |
Against the last 20 years, a 5.29% 10-year is the 100th percentile; against the series back to 1962, it is the median. That doesn't make it fair value, because the inflation, growth, and policy regimes are all different. It does mean that treating the yields of the 2010s as the natural resting place for rates is a mistake, which raises the question of what made the 2010s the 2010s.
Aging, QE, and the Price of Duration
The tidy version of my argument would be that aging raises rates, and it's wrong: the dependency ratio started rising after 2008, and Treasury yields fell. Aging changes saving, investment demand, and labor supply all at once, and some of those push rates down. What aging also does, however, is grow the government's pension and health commitments relative to the people paying for them, and after 2008 there was a very large buyer absorbing the consequences.
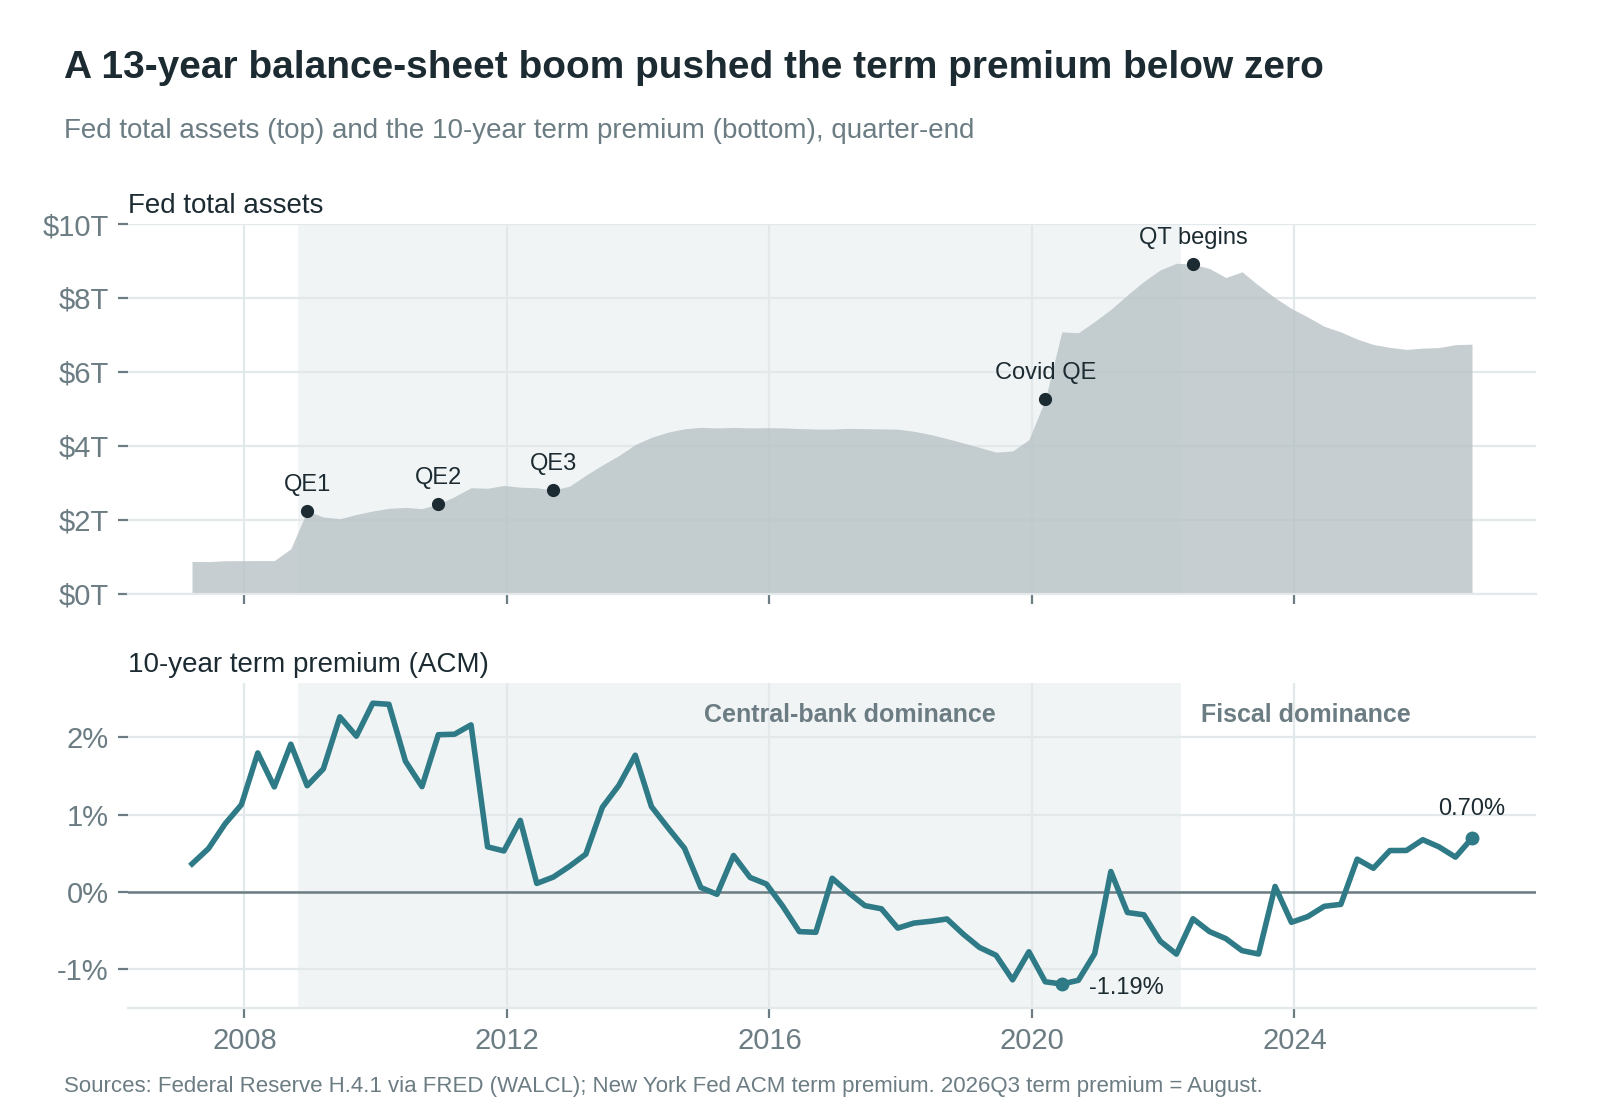
The Fed’s balance sheet expanded dramatically after 2008 and again during the pandemic. Those purchases took duration out of private portfolios, and the less duration private investors have to hold, the less they need to be paid to hold it. That payment is the term premium, and by the estimate shown here it went negative. (It is a model estimate, not an observed price, and QE wasn't the only thing holding yields down: weak demand, inflation expectations, and global saving all mattered.)
The two series don't move in lockstep, and I wouldn't claim a fixed lag between them. The point is simpler: during QE the Fed was carrying duration that private investors otherwise would have had to carry themselves. To the extent it carries less, the question for the long end is how much duration private investors must absorb, and what they need to be paid to hold it.
The Fiscal Flywheel
This is where the fiscal channel turns into a loop. If the Fed absorbs less duration, private investors carry more of it; they want compensation, which raises long rates, which raises the cost of refinancing the debt, which, absent an offset in taxes or primary spending, means bigger deficits and more issuance.
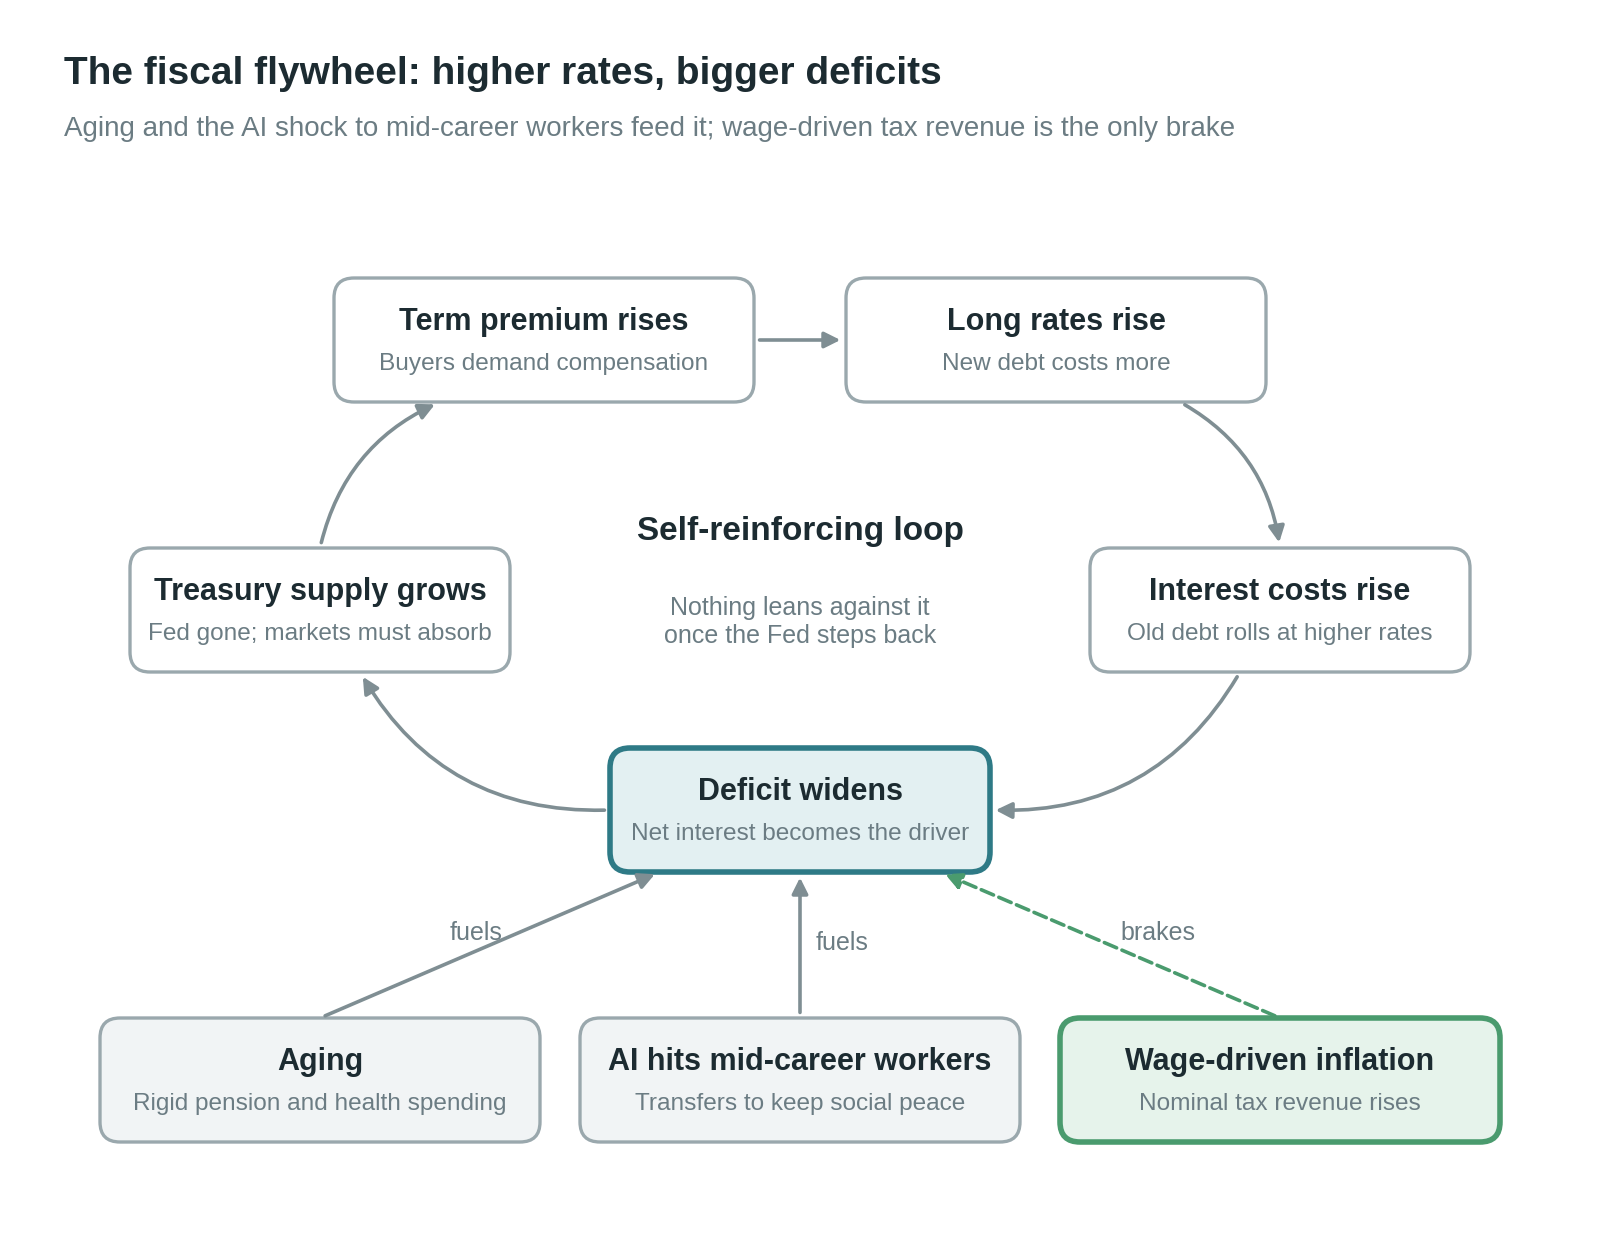
CBO’s 2026–2036 baseline shows the exposure: net interest rises from 3.3% to 4.6% of GDP even as the primary deficit narrows from 2.6% to 2.1%. In other words, the projected deterioration is all interest. Aging pushes on the same loop from the other side, through pension and health commitments that grow relative to the tax base.
A flywheel is not destiny. More supply only raises the term premium if demand doesn't keep up and policy credibility is in doubt, and governments have choices: participation, migration, tax policy, and benefit rules all move the borrowing requirement. Those choices are politically difficult, which is different from unavailable.
The escape hatch people usually reach for is inflation, and it's true that inflation flatters the fiscal math for a while: nominal revenue rises right away, while existing debt reprices slowly. It doesn't last; indexed benefits, public wages, and refinancing costs all catch up. The vulnerable moment is the one where nominal revenue growth slows while the debt is still rolling over at higher rates. That is why the things to watch are receipts and the maturity schedule; the gap between the average coupon on outstanding debt and today's 10-year yield tells you about exposure, not the eventual interest bill.
Consumption and Capacity
Step back, and there is a simple way to organize all of this: an economy has consumption power and productive capacity, and persistent mismatches between the two show up as inflation or deflation, and eventually in fiscal policy.
| Consumption power | Productive capacity | Result of the imbalance | 10-year government yield | |
|---|---|---|---|---|
| United States | Strong: household borrowing and fiscal deficits prop up demand | Short: an aging workforce, supply can't keep up | Inflation and deficits | 5.29% |
| China | Weak: high savings, low consumption | Excess: capacity has to be exported | Deflation | ~1.67% |
The table is deliberately stylized; it is not a decomposition of either country’s bond yield, and an export surge doesn't prove an economy-wide capacity surplus. The contrast is still useful: the U.S. has relatively strong demand running into supply constraints, and China has substantial industrial capacity without the domestic demand to absorb it.
Seen this way, Bessent's productivity bet is straightforward: if AI lets the workforce produce more, supply catches up with demand, inflation pressure eases, and rates can come down. That is the production side. The fiscal side depends on distribution: gains that show up as broad wages and employment support consumption and tax revenue; gains that concentrate in profits while labor income falls leave the outcome up to taxation, transfers, and whether new work appears.
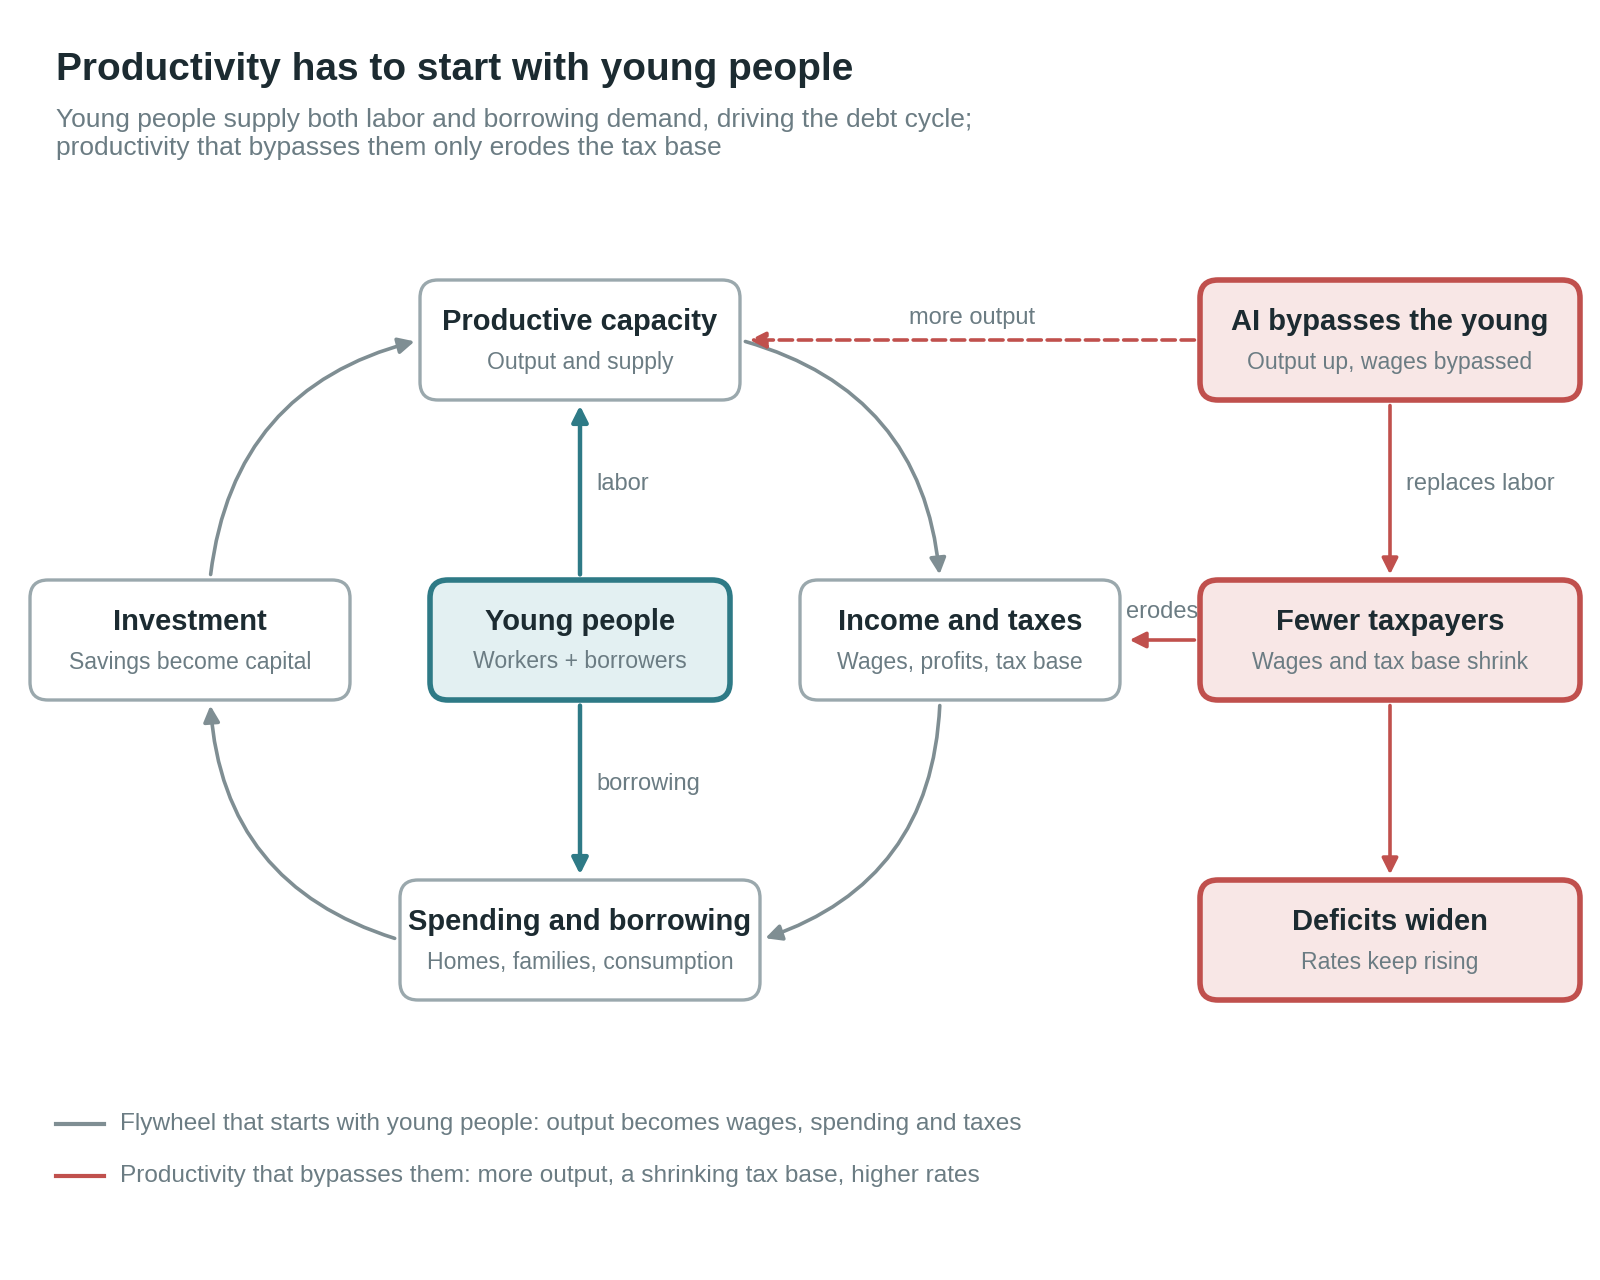
The diagram shows the two paths. In the first, productivity flows through wages into consumption and taxes (young workers sit at the center because they determine how durable those flows are; productivity doesn't have to originate with them). In the second, AI bypasses the wage step: displacement weakens labor income faster than new employment or other income restores it, and what happens next is up to policy.
AI's Asymmetric Dilemma
The problem with the productivity bet is that its two halves don't arrive at the same time, and the half that arrives first is capital spending. S&P Global Ratings estimates the five largest U.S. hyperscalers will spend about $750 billion on capex in 2026. Through August they had already issued about $220 billion of bonds, and the share of their capex funded with debt has risen from 9% in fiscal 2024 to about 32%. That money comes out of the same pool of capital that funds Treasuries, a point Bessent himself conceded in an August interview with CNBC, saying the AI buildout:
is causing a short-term competition for capital
"Short-term" is doing a lot of work in that sentence. AI investment raises the demand for financing before it raises anyone's productivity. Some of it is funded from cash flow and equity, and monetary policy and global capital flows can offset the pressure, so this is a risk to long rates and not a law. The timing still runs the wrong way for the Treasury.
The harder question is what happens if the technology delivers.
Suppose displacement does reduce household income. The effect doesn't stop at the paycheck: it runs into mortgages and consumption, and from there into unemployment benefits, retraining, and transfers. How large that response is would be a political choice, but the exposure is clear: labor-tax receipts fall, and unless receipts from profits, consumption, or other income rise to match, the government is spending more with less.
That is the asymmetry. If productivity disappoints, the aging-related spending is still there. If productivity arrives but labor income falls, the economy can produce more with less demand to buy it, and the natural response, which is borrowing to support households, restarts the flywheel. The good outcome requires broad wage gains, new jobs, or a tax system that actually collects part of the gain. AI succeeding doesn't tell you which of those you get.
What Could Ease the Pressure
The cleanest fix is a larger working-age population: more workers support output and revenue, and a lower dependency ratio reduces spending pressure relative to the economy. It isn't the only route, because higher participation, better productivity, a credible primary-balance adjustment, and a tax system able to collect part of the gain all help, but it is the one that works on the tax base and the dependency ratio at once.
How Demographics Affect Rates
One detail matters here: young people don't bring low rates directly. Workers early in their careers are borrowers; they buy homes and start families, which pushes up demand for investment. A growing population strengthens fiscal capacity, which is not the same thing as delivering low yields.
Demographics instead act through four channels, and they don't all point the same way.
First, saving. Workers approaching retirement build savings and retirees draw them down; when desired saving outruns investment demand, rates fall. This is the channel in Stanley Fischer’s discussion of low real rates, which describes how aging and saving can lower the equilibrium real rate, and China, with its weak demand, excess saving, and low yields, is the usual comparison (although its rates also reflect policy and the property market). It is also why I keep separating the fiscal pressure from aging from aging's total effect on yields: this channel pushes the other way.
Second, an abundant workforce kept inflation down. From the 1990s through the 2010s, it wasn't only America's boomers entering their prime: the vast young workforces of China and the former Eastern Bloc joined the global economy. Charles Goodhart and Manoj Pradhan, in The Great Demographic Reversal, describe this as the largest positive labor supply shock in history. Plentiful labor kept wage bargaining power weak for decades, which kept inflation low and let central banks hold policy rates down.
Third, the tax base. A broader employed population reduces borrowing needs, other things equal. Actual deficits still depend on tax rates, benefit commitments, and other spending; a favorable age structure gives governments room, and they have to choose to use it.
Fourth, the cash flows behind the debt. Employment and future income are what service both private and public debt. A shrinking workforce weakens those flows relative to obligations that are already fixed, and investors may want more compensation as a result (safe-asset demand and weaker investment can pull the other way).
Put the four together and you have the last four decades: demographics shaped the saving and labor conditions that monetary policy, globalization, and productivity then operated within. That is the real difference in the Greenspan comparison. A productivity gain arrives inside a demographic and fiscal structure, and the same technical improvement can produce a very different distribution of income, and a very different budget, in a different structure.
The trouble is that the demographic fix is slow, and policy has limits. Start with birth rates: a child born today will not join the tax base for roughly two decades, while childcare and education cost money right away, which means a better age structure makes the fiscal picture worse before it makes it better.
Nor is it clear that policy can move the number. Japan recorded just 671,236 births to Japanese nationals in 2025, with a total fertility rate of 1.14, a decline running about 15 years ahead of official projections, even as it commits about ¥3.6 trillion a year to birth-rate measures starting in fiscal 2026. South Korea's fertility rate recovered from 0.72 in 2023 to about 0.8 in 2025, which proves the trend can be arrested, and is still far below the replacement rate of 2.1. Immigration adds working-age people much sooner, as do participation, retraining, and longer working lives, each with its own political and practical constraints.
So no, I don't think long rates are headed back to their 2010s levels. I also don't think aging puts a hard floor under yields. My claim is narrower: age-related spending and debt repricing make a sustained decline hard unless productivity gains broaden taxable income. What would change my mind is stronger real income growth, a better primary balance, or greater private demand for duration.
Greenspan's bet worked because the productivity of the 1990s became household income, and then public revenue; that was his luck. Whether AI's productivity makes the same trip is the question for long-dated Treasuries, and the things to watch are the tax base, the primary balance, the refinancing schedule, and the term premium, together. Birth rates will shape all of that over decades. They are not a trade.
Get the next note
in your inbox.
Free research notes, selected readings and publication updates. No spam, unsubscribe any time.